如图 28 所示,五组真实数值先变成最高、最低、差距和中间组笔记,再组成英语口述;后面的十二个场景都可按此方法练习。
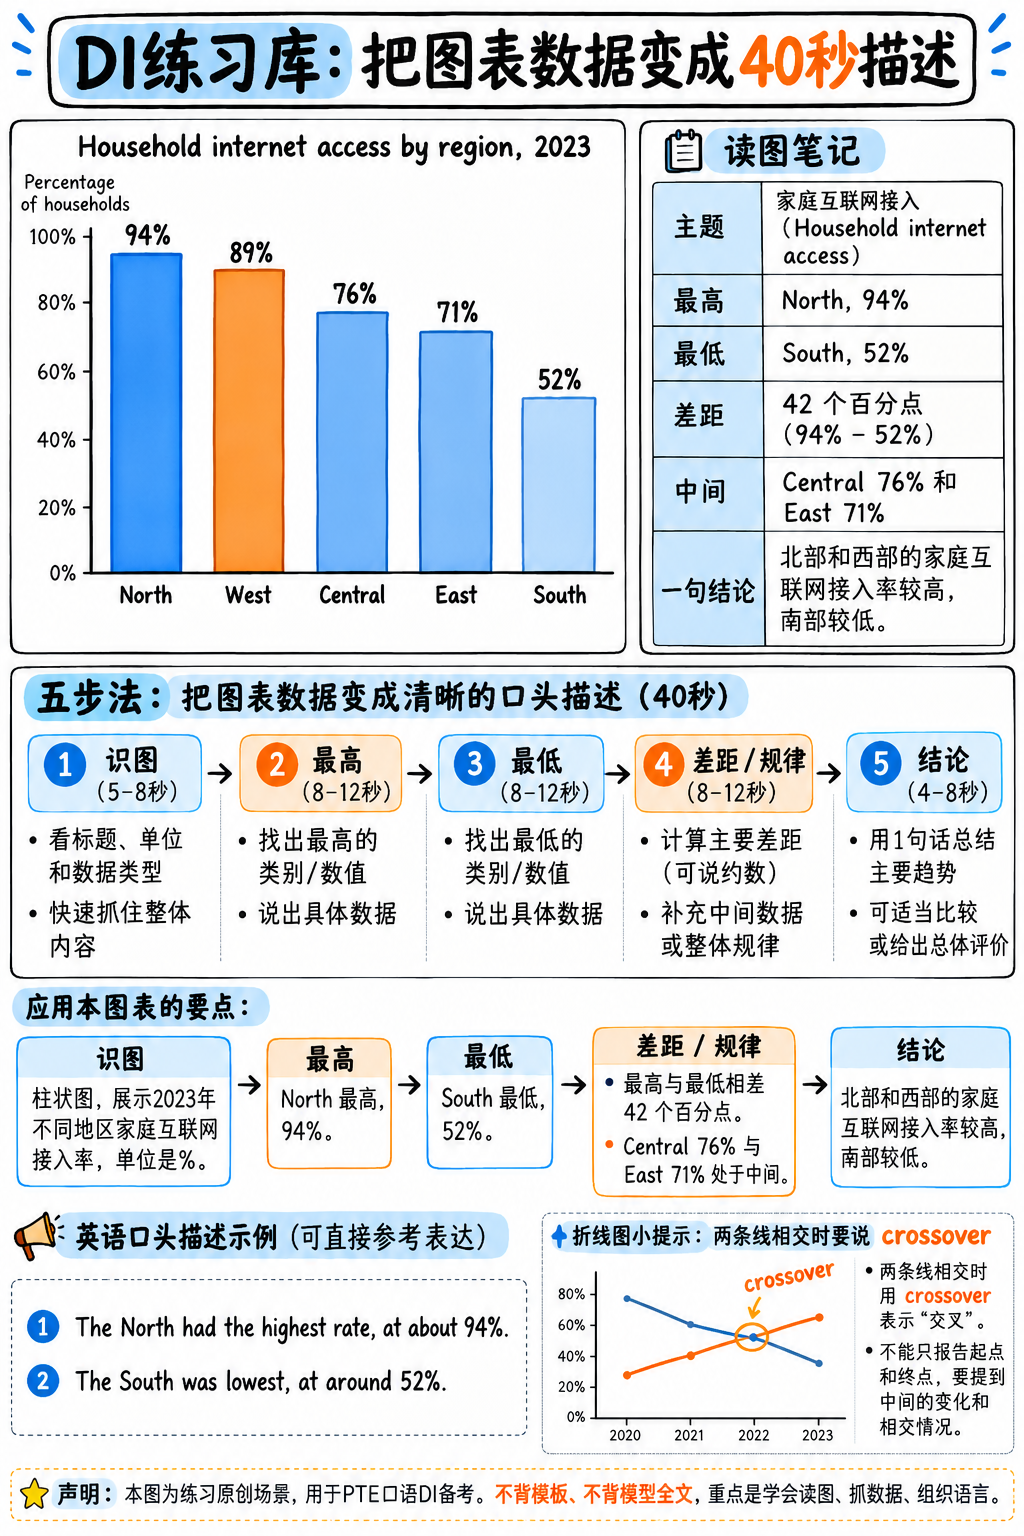
图 28:DI 柱状图数据到 40 秒描述的映射示例。图中数值属于原创练习场景。
重要
题库设计机制与实战训练逻辑 由于纯文本文档无法直观嵌入考场动态图表,本特训库采用全真数据场景文字解构 + 官方满分 40 秒模型示范的方式呈现。
这种方式的训练价值甚至远超看图练习:它直接训练你如何把图表数据转化为高分口语声学输出 —— 迅速决定哪些数据必须读、哪些数据果断略过、以及如何用连贯的句式脚手架串联。
严禁死记硬背示范答案:在 2025 年新机评与真人考官双重复核下,死背答案直接触发 Content=0!请重点内化其“类型识别 ➔ 极值提取 ➔ 宏观特征 ➔ 一句结论”的五段式解题骨架。
场景 01 —— 基础柱状图 (Single Bar Chart)
【图表原始数据】 标题:《2023 年按地区划分的家庭互联网普及率》。五根柱子:北部 94%,西部 89%,中部 76%,东部 71%,南部 52%。
【满分 40 秒示范】
“This bar chart shows household internet access by region in 2023. The North has the highest access at about ninety-four percent, closely followed by the West at eighty-nine. The South is by far the lowest, at just over fifty percent — so there’s a gap of more than forty percentage points between the best and worst regions. Central and East sit in the middle, around seventy to seventy-five percent. Overall, access is high in the north and west but much weaker in the south.”
【中文参考译文】 该柱状图展示了 2023 年各地区的家庭互联网普及率。北部地区的普及率最高,约为 94%,紧随其后的是西部,为 89%。南部地区是迄今为止最低的,仅略高于 50%——因此最好和最差地区之间的差距超过 40 个百分点。中部和东部处于中游水平,在 70% 到 75% 左右。总体而言,北部和西部的互联网接入率很高,但南部则要弱得多。
【核心破题逻辑】 快速识别图表 ➔ 抓最高值 (94%) ➔ 抓最低值 (52%) ➔ 算出极值差 (40% gap) ➔ 概括中游 ➔ 一句总结。报出 5 个关键数字即可,无需机械报菜名。
场景 02 —— 双折线趋势图 (Line Graph with Crossover)
【图表原始数据】 标题:《2000–2020 年燃煤与可再生能源发电量对比(太瓦时)》。煤电:起步 1,800,2010 年达到顶峰 2,100,2020 年降至 1,200。可再生能源:起步 200,2012 年前平缓升至 500,随后陡峭飙升至 2020 年的 1,400。两条折线在 2019 年发生历史性交叉!
【满分 40 秒示范】
“This line graph compares coal and renewable electricity generation from 2000 to 2020, measured in terawatt-hours. Coal rose from about eighteen hundred to a peak of around twenty-one hundred in 2010, and then declined steadily to roughly twelve hundred. Renewables moved in the opposite direction — flat at first, around two hundred, but climbing sharply after 2012 to about fourteen hundred. The two lines cross at the end of the period, so renewables overtook coal around 2019.”
【中文参考译文】 该折线图对比了 2000 年至 2020 年燃煤与可再生能源的发电量(以太瓦时计)。燃煤发电量从约 1,800 升至 2010 年约 2,100 的峰值,随后稳步下降至大约 1,200。可再生能源的走势则截然相反——起初平稳在 200 左右,但在 2012 年后急剧攀升至约 1,400。这两条线在统计周期末尾发生交叉,因此可再生能源在大约 2019 年实现了对燃煤的反超。
【核心破题逻辑】 双折线图的终极命脉在于寻找交叉点 (Crossover)!点出两条线的起点、峰值以及“2019年反超”,内容分直接打满。
场景 03 —— 占比饼图 (Pie Chart)
【图表原始数据】 标题:《2024 年某大学财政开支构成》。教职工薪酬 58%,建筑与维护 17%,科研经费 12%,学生服务 8%,行政管理 5%。
【满分 40 秒示范】
“This pie chart shows how a university spent its money in 2024. By far the largest share goes to staff salaries, at nearly sixty percent — more than all other categories combined. Buildings and maintenance is the second largest at seventeen percent, followed by research at twelve. Student services and administration are the smallest, together accounting for only about thirteen percent. So the overall picture is that spending is dominated by staffing costs.”
【中文参考译文】 该饼图展示了某大学在 2024 年的资金支出分布。教职工薪酬占据了迄今为止最大的份额,接近 60%——超过了所有其他类别的总和。建筑与维护是第二大支出,占 17%,其次是科研,占 12%。学生服务和行政管理是最小的支出项,两者合计仅占约 13%。因此,总体情况是各项开支主要由人员薪酬所主导。
【核心破题逻辑】 锁定最大扇区 (58%) ➔ 给出实质性洞察(“超过其他所有项目总和”) ➔ 降序报出第二大与第三大项 ➔ 打包合并最小的两项 ➔ 宏观总结。
场景 04 —— 多变量数据表格 (Data Table)
【图表原始数据】 标题:《四座城市的年均降雨量与平均气温》。城市 A:620 mm,11°C。城市 B:1,850 mm,24°C。城市 C:310 mm,18°C。城市 D:980 mm,9°C。
【满分 40 秒示范】
“This table presents average annual rainfall and temperature for four cities. City B is both the wettest and the warmest, with about eighteen hundred and fifty millimetres of rain and an average of twenty-four degrees. City C is the driest at only three hundred and ten millimetres. City D is the coldest, at nine degrees, but still receives nearly a thousand millimetres of rain. So rainfall and temperature don’t move together here — the driest city is not the coldest one.”
【中文参考译文】 该表格展示了四座城市的年均降雨量和平均气温。城市 B 既是降雨最多也是最温暖的城市,降雨量约为 1,850 毫米,平均气温为 24 度。城市 C 最干燥,仅有 310 毫米降水。城市 D 最寒冷,为 9 度,但仍有接近 1,000 毫米的降雨量。因此,这里的降雨量和气温并没有呈现同向变动——最干旱的城市并不是最寒冷的城市。
【核心破题逻辑】 绝不要把 4 行 2 列的所有数据挨个念一遍!分别挑出两项指标的极值(最湿热的是 B,最干的是 C,最冷的是 D),并给出一句关联性总结。
场景 05 —— 地理区域地图 (Map)
【图表原始数据】 一座虚构岛屿的地理地图。北海岸有一条山脉。三个城市均分布在南部和东部海岸。一条河流从山脉发源向东南流淌直达最大城市。西北部覆盖森林;南部为大片农田。
【满分 40 秒示范】
“This map shows an island and its main geographical features. A mountain range runs along the northern coast, with forest covering the north-west. All three of the cities marked are on the southern and eastern coasts, away from the mountains. A river flows from the mountains south-east and reaches the largest city. The southern part of the island is mostly farmland. So settlement and agriculture are concentrated in the south, probably because the north is too mountainous and forested.”
【中文参考译文】 该地图展示了一座岛屿及其主要地理特征。北部海岸分布着一条山脉,西北部被森林所覆盖。标出的三座城市全部位于远离山脉的南部和东部海岸。一条河流从山脉向东南流淌并贯通最大城市。岛屿南部大部分为农田。因此,聚落和农业主要集中在南部,这可能是因为北部地形过于多山且森林密布。
【核心破题逻辑】 地图题的核心是方位词 (north, south, east, west)!指认物理特征 ➔ 描述相对位置 ➔ 合理解释人类活动聚集在南部的地理原因。
场景 06 —— 循环流程图 (Process Cycle)
【图表原始数据】 标题:《废纸回收利用流程》。五大箭头阶段:1. 废纸回收 ➔ 2. 按等级分拣 ➔ 3. 加水与化学剂制浆 ➔ 4. 筛选脱墨 ➔ 5. 压榨烘干成新纸卷。阶段 5 有一个箭头重新回环指向阶段 1!
【满分 40 秒示范】
“This diagram shows the paper recycling process, in five stages. It begins with collection of waste paper, which is then sorted by grade. In the third stage the sorted paper is pulped with water and chemicals to break it down into fibres. Next, the pulp is screened and de-inked to remove contaminants and printing ink. Finally it’s pressed and dried into new rolls of paper. An arrow returns from the final stage to collection, showing that the process is a continuous cycle.”
【中文参考译文】 该示意图展示了废纸回收处理的五个主要阶段。它始于废纸的收集,随后按等级进行分拣。在第三阶段,分拣后的纸张与水和化学试剂混合制浆,以分解为纤维。接下来,纸浆经过筛选和脱墨处理以去除杂质和印刷油墨。最后,纸浆被压榨并烘干制成新的纸卷。一个箭头从最终阶段返回至收集阶段,表明该过程是一个持续循环。
【核心破题逻辑】 交代总阶段数 ➔ 运用时序连接词 (begins with, then, next, finally) 串联 ➔ 特别点出末尾箭头形成的闭环 (continuous cycle)。
场景 07 —— 双分组对比柱状图 (Grouped Bar Chart)
【图表原始数据】 标题:《毕业六个月后的毕业生就业率(按学科与性别划分)》。工程学:男性 88%,女性 85%。商科:男性 81%,女性 83%。人文学科:男性 64%,女性 69%。艺术学科:男性 55%,女性 61%。
【满分 40 秒示范】
“This chart compares graduate employment six months after graduation, across four subject areas and split by gender. Engineering has the highest employment overall, at around eighty-five to ninety percent for both groups. Arts is the lowest, in the mid-to-high fifties for men and around sixty percent for women. Interestingly, women have slightly higher employment than men in three of the four subjects — business, humanities and arts — with engineering the only exception. So subject matters much more than gender here.”
【中文参考译文】 该图表对比了四个学科领域毕业六个月后的毕业生就业率,并按性别进行了细分。工程学的整体就业率最高,男女两组均在 85% 到 90% 左右。艺术类最低,男性在 50% 中高段,女性在 60% 左右。有趣的是,在四个学科中的三个学科(商科、人文学科和艺术类)中,女性的就业率略高于男性,工程学是唯一的例外。因此,在这里学科对就业率的影响远大于性别差异。
【核心破题逻辑】 说明对比维度 ➔ 点出工程学最高与艺术学最低 ➔ 抓住核心反常反差(女性在 3 个学科中就业率反超男性) ➔ 总结结论。
场景 09 —— 真实户外摄影照片 (Photograph)
【图表原始数据】 一张热闹的户外露天农贸集市照片。前景为摆满新鲜蔬菜的摊位,带有“Saturday Market”标牌。中景为拥挤的人群手提购物袋穿行。背景隐约可见一座古老教堂钟楼。天空阴沉多云。
【满分 40 秒示范】
“This photograph shows a busy outdoor market, apparently a farmers’ market. In the foreground there are stalls displaying fresh vegetables, with a sign reading ‘Saturday Market’. A large crowd of people is moving between the stalls, many carrying shopping bags. Behind the market I can see a church tower, which suggests this is in the centre of an older town. The sky is overcast, so the weather doesn’t seem to be keeping people away. Overall it looks like a well-attended weekly market.”
【中文参考译文】 这张照片展示了一个繁忙的户外集市,显然是一个农贸市场。在前景中有陈列着新鲜蔬菜的摊位,上面有一块写着“周六集市”的标牌。大批人群在摊位之间穿梭,许多人手里拎着购物袋。在集市后方我可以看到一座教堂钟楼,这表明这里位于一座历史悠久城镇的中心地带。天空阴沉多云,因此阴天似乎并没有阻挡人们的热情。总体而言,这看起来是一个热闹且参与度极高的定期周度集市。
【核心破题逻辑】 面对看不懂深层含义的照片时,严格按空间物理位置描述肉眼所见(前景 foreground ➔ 人物动作 ➔ 背景 background ➔ 从标牌推论)。
场景 10 —— 柱线复合图 (Combined Chart: Revenue & Profit Margin)
【图表原始数据】 标题:《2018–2023 年某公司营业收入与利润率》。柱形(营业收入,百万美元):120, 145, 138, 180, 215, 240。折线(利润率,%):12, 11, 4, 9, 14, 13。
【满分 40 秒示范】
“This chart combines two measures for a company from 2018 to 2023. The bars show revenue, which grew from about a hundred and twenty million dollars to two hundred and forty — roughly doubling, with only one dip, in 2020. The line shows profit margin, which behaved quite differently: it fell sharply to about four percent in 2020, recovered to fourteen percent by 2022, and then eased slightly. So revenue grew steadily, but profitability was much more volatile, with 2020 clearly a difficult year.”
【中文参考译文】 该图表结合了一家公司在 2018 年至 2023 年间的两项核心财务指标。柱状图代表营业收入,从约 1.2 亿美元增长至 2.4 亿美元——大致翻了一番,仅在 2020 年出现过一次短暂回落。折线代表利润率,其表现截然不同:在 2020 年急剧下滑至约 4%,到 2022 年恢复至 14%,随后略有回落。因此,虽然营收保持了稳步增长,但盈利能力的波动性要大得多,2020 年显然是一个艰难的年份。
【核心破题逻辑】 明确指出复合图的双轴含义 ➔ 描述柱状图(营收翻倍) ➔ 描述折线图(利润率波动) ➔ 对比两者的走势差异。
场景 11 —— 带有条件分支的决策流程图 (Flow Chart with Decisions)
【图表原始数据】 标题:《学术期刊论文审稿规程》。起点:投稿 ➔ 编辑初审 ➔ 决策菱形“是否合规?” ➔ 否:直接拒稿;是:送交两位同行评审专家 ➔ 决策菱形“是否接收?” ➔ 否:大修后重新提交(箭头回环指向评审专家);是:文字校对 ➔ 正式出版。
【满分 40 秒示范】
“This flow chart shows how a journal article is reviewed. The process starts with submission, followed by an initial check by the editor, who decides whether the article is suitable. If it isn’t, it’s rejected at that point. If it is, it goes to two peer reviewers, who then decide whether to accept it. If they don’t accept it, the author revises and resubmits, and it returns to the reviewers — so this stage can repeat. Once accepted, the article is copy-edited and published.”
【中文参考译文】 该流程图展示了学术期刊论文的审稿规程。整个过程始于投稿,随后由编辑进行初步审核,以决定论文是否合适。如果不合适,将在该阶段直接予以拒稿。如果合适,论文将送交两位同行评审专家,由他们决定是否予以接收。如果不接收,作者需要修改并重新提交,随后再次返回给审稿专家——因此这一阶段可能会循环重复。一旦被正式接收,文章将经过文字校对并最终出版。
【核心破题逻辑】 流程图的关键在于两难分支的处理 (If it isn’t… / If it is…),点出循环修改的闭环过程。
场景 12 —— 堆叠百分比柱状图 (Stacked Bar Chart, 100%)
【图表原始数据】 标题:《四个国家的能源结构占比 (%)》。国家 A:煤炭 65, 天然气 20, 可再生 10, 核能 5。国家 B:煤炭 10, 天然气 25, 可再生 30, 核能 35。国家 C:煤炭 30, 天然气 45, 可再生 20, 核能 5。国家 D:煤炭 5, 天然气 10, 可再生 80, 核能 5。
【满分 40 秒示范】
“This stacked bar chart shows the energy source mix for four countries, each totalling a hundred percent. The mixes are very different. Country A relies heavily on coal, at about sixty-five percent. Country D is almost the opposite, with eighty percent from renewables. Country B is the only one with substantial nuclear power, at around thirty-five percent, while Country C depends mainly on gas, at forty-five. So each country has a clearly dominant source, but it’s a different source in each case.”
【中文参考译文】 该堆叠柱状图展示了四个国家的能源供应结构组合,每个国家的总和均为 100%。各国的能源组合差异极大。国家 A 严重依赖煤炭,占比约为 65%。国家 D 则截然相反,80% 的能源来自可再生能源。国家 B 是唯一拥有大量核电的国家,占比约为 35%,而国家 C 主要依赖天然气,占比为 45%。因此,每个国家都有一种明确占据主导地位的能源,但各国的优势能源各不相同。
【核心破题逻辑】 堆叠柱状图不要横向念数据,要纵向找出每个国家的单一最大支柱 (Dominant Source)!对比强烈,说理极有穿透力。
每日 10 秒极限抓极值训练 (Sprint Drill)
在进行 40 秒完整输出之前,每天练习以下三项微习惯:
10 秒极值冲刺:任意找一张统计图,强制自己在 10 秒内脱口而出:“The highest is [A] at about [X], and the lowest is [B] at about [Y].” 每天练 20 张图。
2 秒图表定性:扫一眼图片,2 秒内报出图表类型:bar chart, line graph, pie chart, table, map, process diagram, stacked chart。
15 秒大趋势定性:用一句话说出图表反映的最显著特征。